What are parameters?

Parameters are three constants in the sinusoidal function formula: a, b and c.
The three different parameters each play different roles in forming a sinusoidal curve.
The three different parameters each play different roles in forming a sinusoidal curve.
How do each parameter affect the sinusoidal curve?
To see how the value of each parameter affects the curve, we can compare with the standard sinusoidal curve which is:


value of a


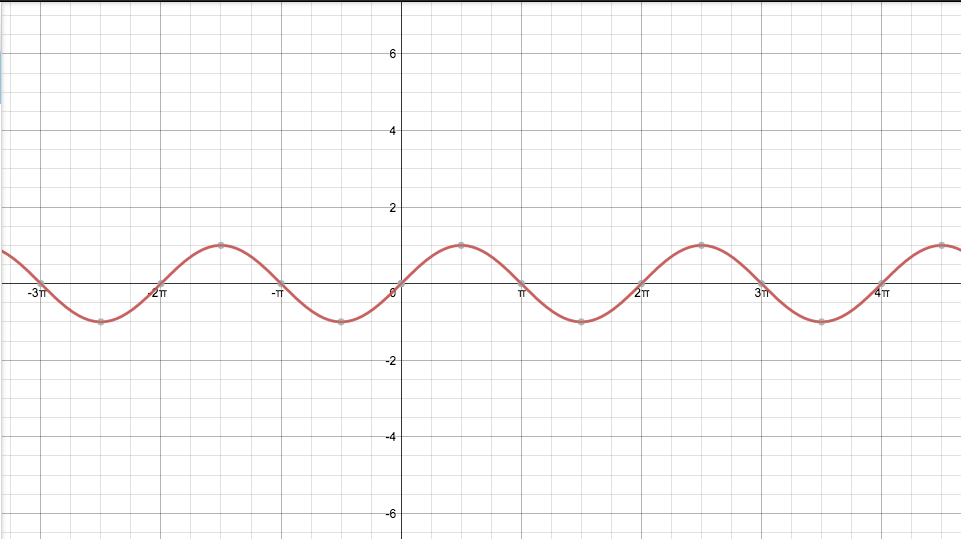
When the [a] value is 1, the curve looks exactly the same as the curve created by the standard sinusoidal function, because it is the same thing. 1 is just hidden in front of sin.
|


|


With 3 different outcomes, we can see a pattern.
Here, we see: as the [a] value increases, the height of the sinusoidal curve increases. |


|
|
What is going to come next?
Making a prediction based on a pattern from previous results, is an excellent way to verify your pattern and to test your understanding. |
What would the graph of y= 5sin (1x) +0 look like?
My prediction for how the sinusoidal curve would look like when the function y= 5sin (1x) +0 is applied, is this:
The sinusoidal curve created will have an amplitude of 5, so the maximum point will be 5 and the minimum point will be -5. |
How is my prediction reasonable?
My hypothesis is reasonable because it was made based on previous results, and I could see that the pattern was that the amplitude of a sinusoidal curve is equal to the absolute value of the a parameter, or |a|. When the [a] value is 5, I know that the amplitude will be 5 and as the sinusoidal curve is periodic, the maximum and minimum points on the curve would be constant.
|
Was my prediction correct?
Yes, because the graph looked exactly as how I described it.
|

|


When the a value is negative, it becomes interesting.
Can you see what changed from the standard sinusoidal curve when the [a] value is negative? |


|

A negative [a] value makes the curve look like it has been flipped upside down from the original, which is when the [a] value is positive.

The value of [a] determines the amplitude of a sinusoidal curve.
It controls the maximum / minimum values of the graph. |
|
|a| = amplitude = distance between the origin and the maximum / minimum point
value of b


When the [b] value is 1, the curve looks exactly the same as the curve created by the standard sinusoidal function, because it is the same thing. 1 is just hidden in front of x.
|


|


Again, we see a pattern after examining three different datas. Increasing the [b] value increases the frequency of the sinusoidal curve.
An increase in the [b] value decreases the wavelength of the sinusoidal curve. |


|
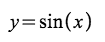
What would the graph of y= 1sin (5x) +0 look like?
My prediction for how the sinusoidal curve would look like when the function y= 1sin (5x) +0 is applied, is this:
The sinusoidal curve created will have a frequency of 5, so there would be 5 individual periods inside the period of 2𝝅.
The sinusoidal curve created will have a frequency of 5, so there would be 5 individual periods inside the period of 2𝝅.
How is my prediction reasonable?
My hypothesis is reasonable because it was made based on previous results, and I could see that the pattern was that the number of periods inside the standard period of 2𝝅 is equal to the value of the b parameter. When the [b] value is 5, I know that the number of periods inside the standard period of 2𝝅 is 5.
|
Was my prediction correct?
Yes, because the graph looks exactly like how I have predicted it.
|

|


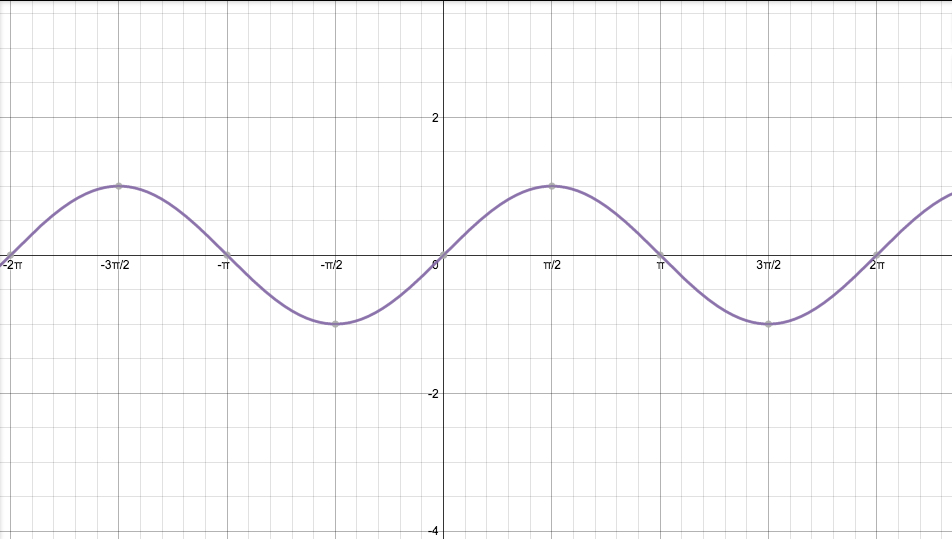
This looks eerily familiar... it looks exactly the same as the sinusoidal curve created when the function was:

|


|
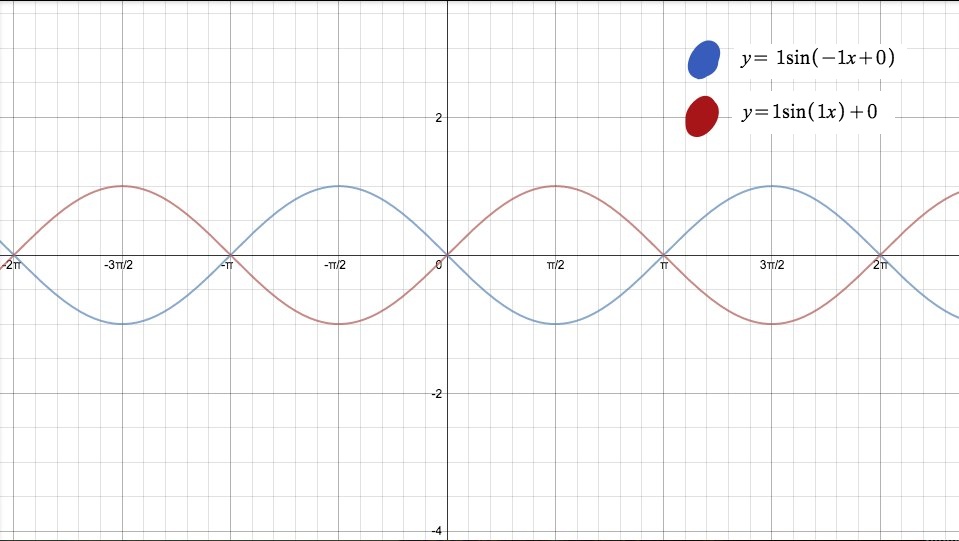
Again, a negative value creates a curve that forms a mirror image to the curve created by a positive value.

The value of [b] changes the wavelength or the frequency of a sinusoidal curve.
The [b] value is the number of individual periods inside the standard sinusoidal curve, with 2𝝅 being its period. For example, when the [b] value is 2, the number of periods inside the standard sinusoidal curve is 2. |
|
b = frequency = number of periods inside the standard period of 2𝝅
value of c


|
There are two different formulas.
The value of the c parameter in the first formula moves the curve vertically on the graph, and the value of c in the second formula moves the curve horizontally on the graph. |

|

|

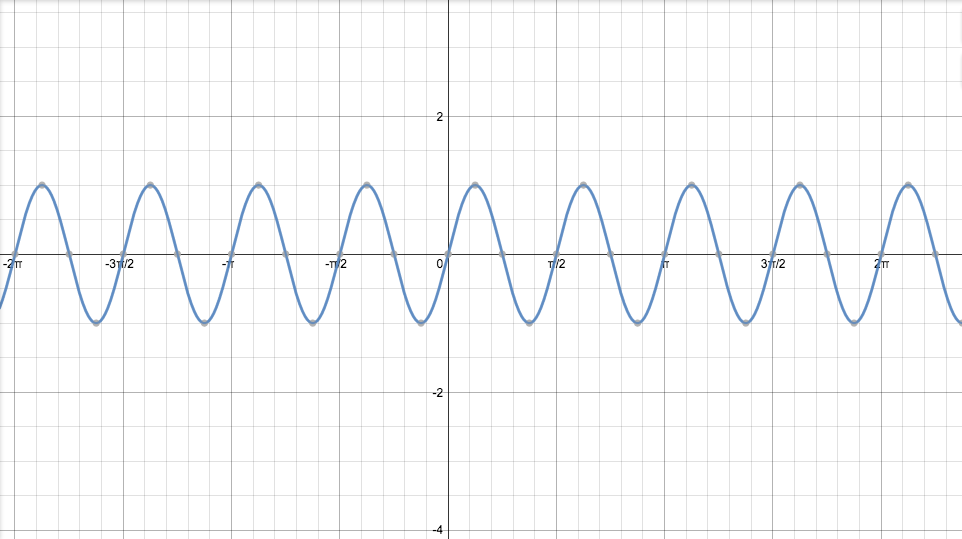
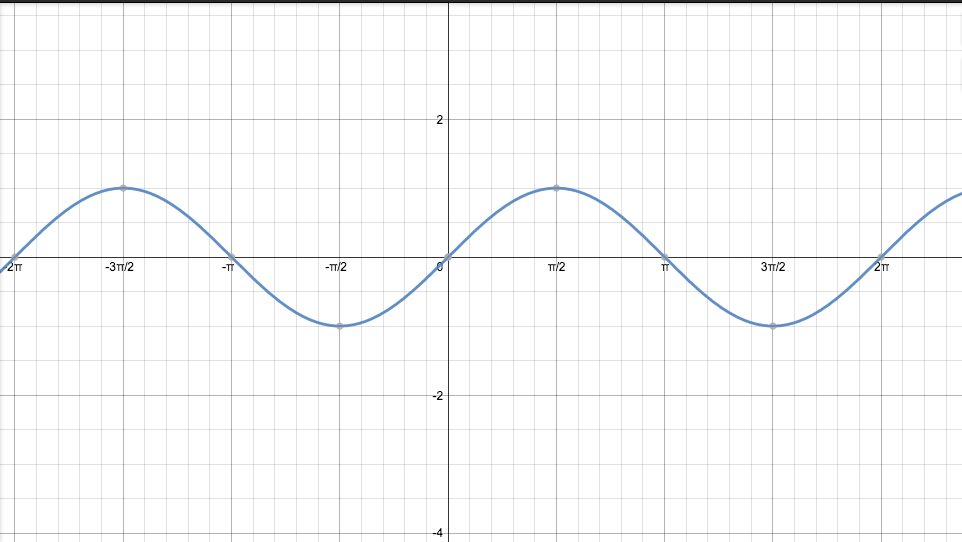
When the value of [c] is 0, the curve looks identical to the curve created by the standard sinusoidal function, because it is the same thing.
Why isn't the value of [c] equal to 1 for the standard sinusoidal function? This is because the additive identity is 0. The value of the two other parameters must equal to 1, because 1 is the multiplicative identity, and parameters [a] and [b] are multiplied in the formula. |


Additive identity = 0
Multiplicative identity = 1 |
How is the multiplicative identity 1, and the additive identity 0?
0 is the additive identity because:
0 + (number) = (number)
0 added to any number, equals that number. It does not affect the value or the direction of the number.
e.g. 1) 0 + 3 = 3
e.g. 2) 0 + 17 = 17
e.g. 3) 0 + (-36) = -36
e.g. 4) 0 + (-3.562) = -3.562
e.g. 5) 0 + 𝒆 = 𝒆
0 is the additive identity because:
0 + (number) = (number)
0 added to any number, equals that number. It does not affect the value or the direction of the number.
e.g. 1) 0 + 3 = 3
e.g. 2) 0 + 17 = 17
e.g. 3) 0 + (-36) = -36
e.g. 4) 0 + (-3.562) = -3.562
e.g. 5) 0 + 𝒆 = 𝒆
1 is the multiplicative identity because:
1 x (number) = (number)
1 multiplied by any number, equals that number. Again, it does not affect the value or the direction of the number.
e.g. 1) 1 x 9 = 9
e.g. 2) 1 x 728394 = 728394
e.g. 3) 1 x (-27415) = -27415
e.g. 4) 1 x (-7.5) = -7.5
e.g. 5) 1 x 𝝅 = 𝝅
1 x (number) = (number)
1 multiplied by any number, equals that number. Again, it does not affect the value or the direction of the number.
e.g. 1) 1 x 9 = 9
e.g. 2) 1 x 728394 = 728394
e.g. 3) 1 x (-27415) = -27415
e.g. 4) 1 x (-7.5) = -7.5
e.g. 5) 1 x 𝝅 = 𝝅


The pattern is that the curve moves vertically when the [c] value changes for the first formula. When the [c] value is positive, the curve moves up the y axis.
|


|
How would the curve move when the value of the c parameter is negative?
My prediction:
I think the curve will move downwards the y axis, because after scrutinizing the three results I found a pattern that the curve is moving up the y axis as the value of the c parameter increases. Therefore, when the value of [c] decreases, the curve will go downwards.
My prediction:
I think the curve will move downwards the y axis, because after scrutinizing the three results I found a pattern that the curve is moving up the y axis as the value of the c parameter increases. Therefore, when the value of [c] decreases, the curve will go downwards.
|
Was my prediction correct?
Yes, because the curve did move downwards the y axis.

|

|

The value of [c] changes the location of a sinusoidal curve.
With the formula: y=a[sin(bx)]+c, the [c] value moves the curve vertically on the y axis. A positive c value moves it up the y axis, and a negative c value moves it down the y axis. With the formula: y=a sin(bx+c), the [c] value moves the curve horizontally across the x axis. A positive c value moves it to the left, and a negative c value moves it to the right. |

|
For example:
- Using the formula y=a[sin(bx)]+c, when the value of [c] is 1, the y intercept would be 1.
- Using the formula y=a sin(bx+c), when the value of [c] is 1, the x intercept would be -1.
- Using the formula y=a[sin(bx)]+c, when the value of [c] is 1, the y intercept would be 1.
- Using the formula y=a sin(bx+c), when the value of [c] is 1, the x intercept would be -1.
C = location = the location on the y axis and the x axis
